Tutorial
Here is the table of contents for the webpage. You can directly navigate to a topic of interest by clicking on it.
Part1:Use Analysis Methods
- 1-1-1:Retrieve HDV genomes
- 1-1-2:Generate Tree Pair
- 1-2:PI (S-HDAg)
- 1-3:PI (L-HDAg)
- 1-4:Secondary Structure of HDV genome
- 1-5:Nucleotide logo
- 1-6:Protein logo
- 1-7:World Map
Part2:Tools
Part1:Use Analysis Methods
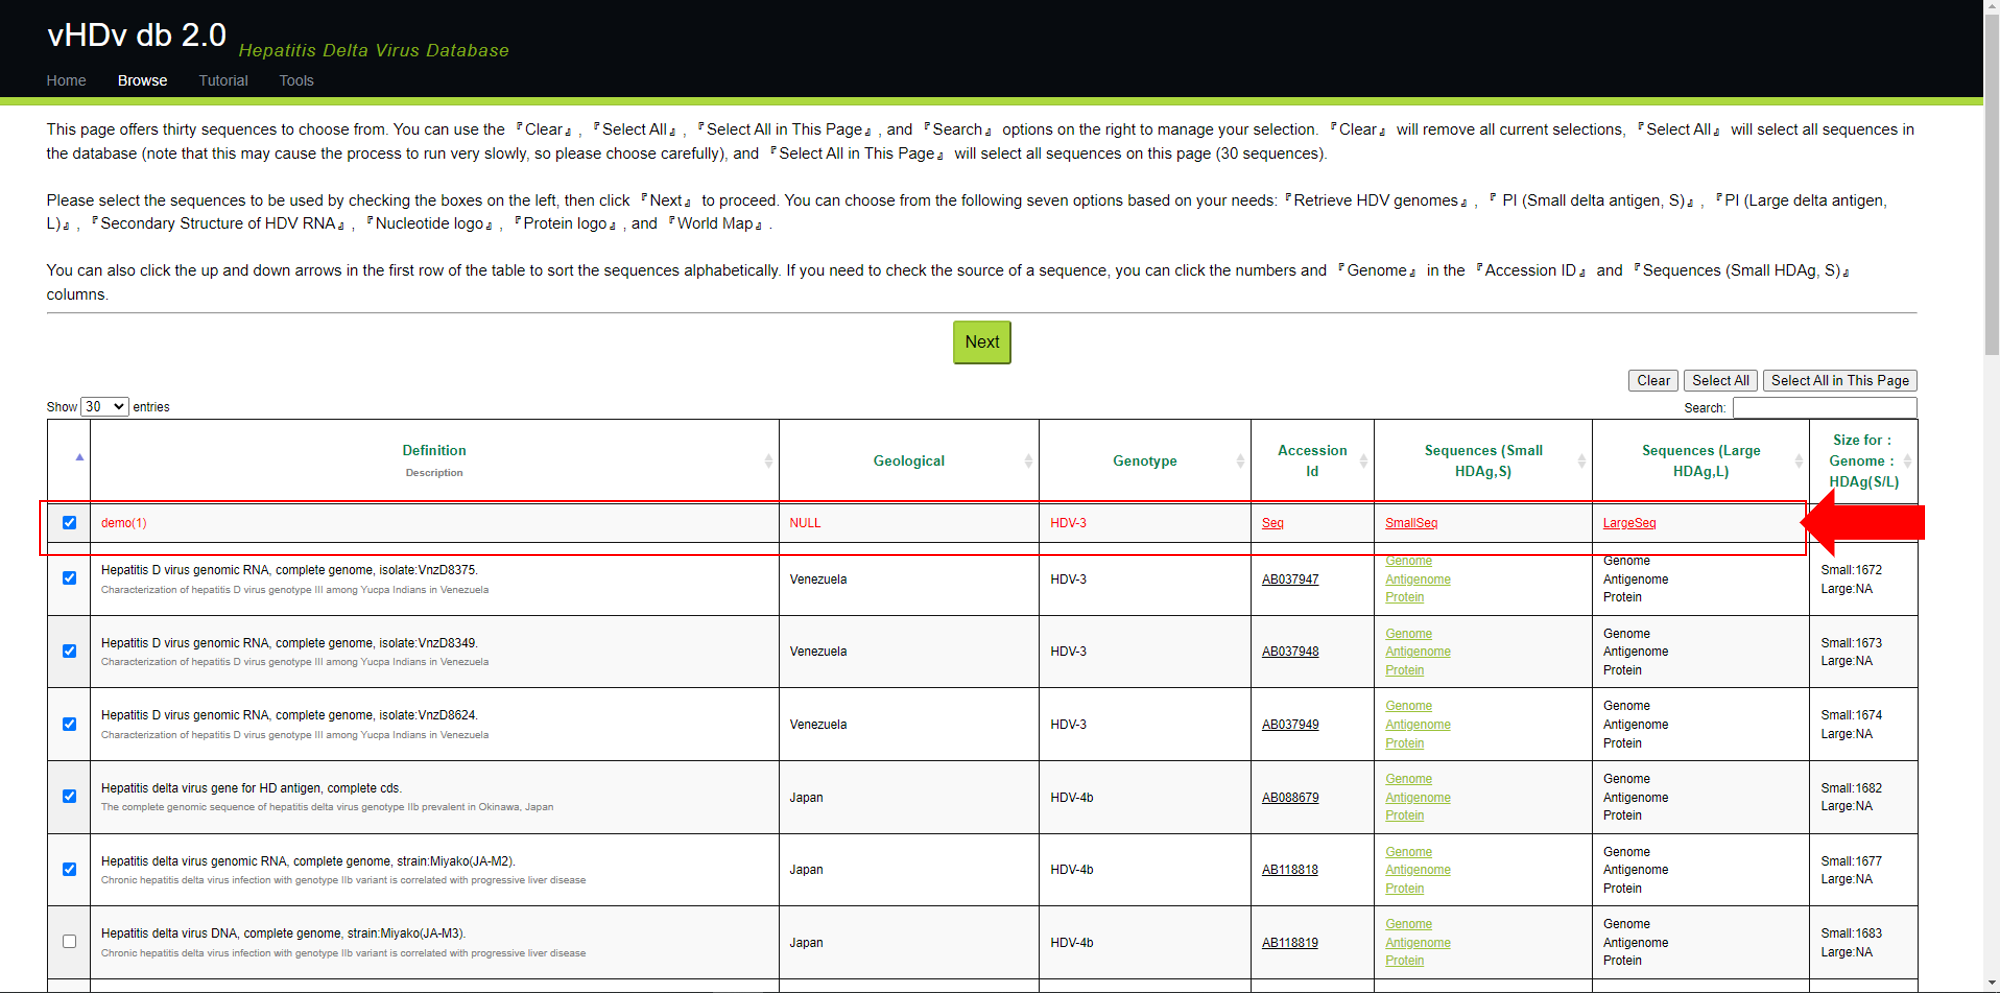
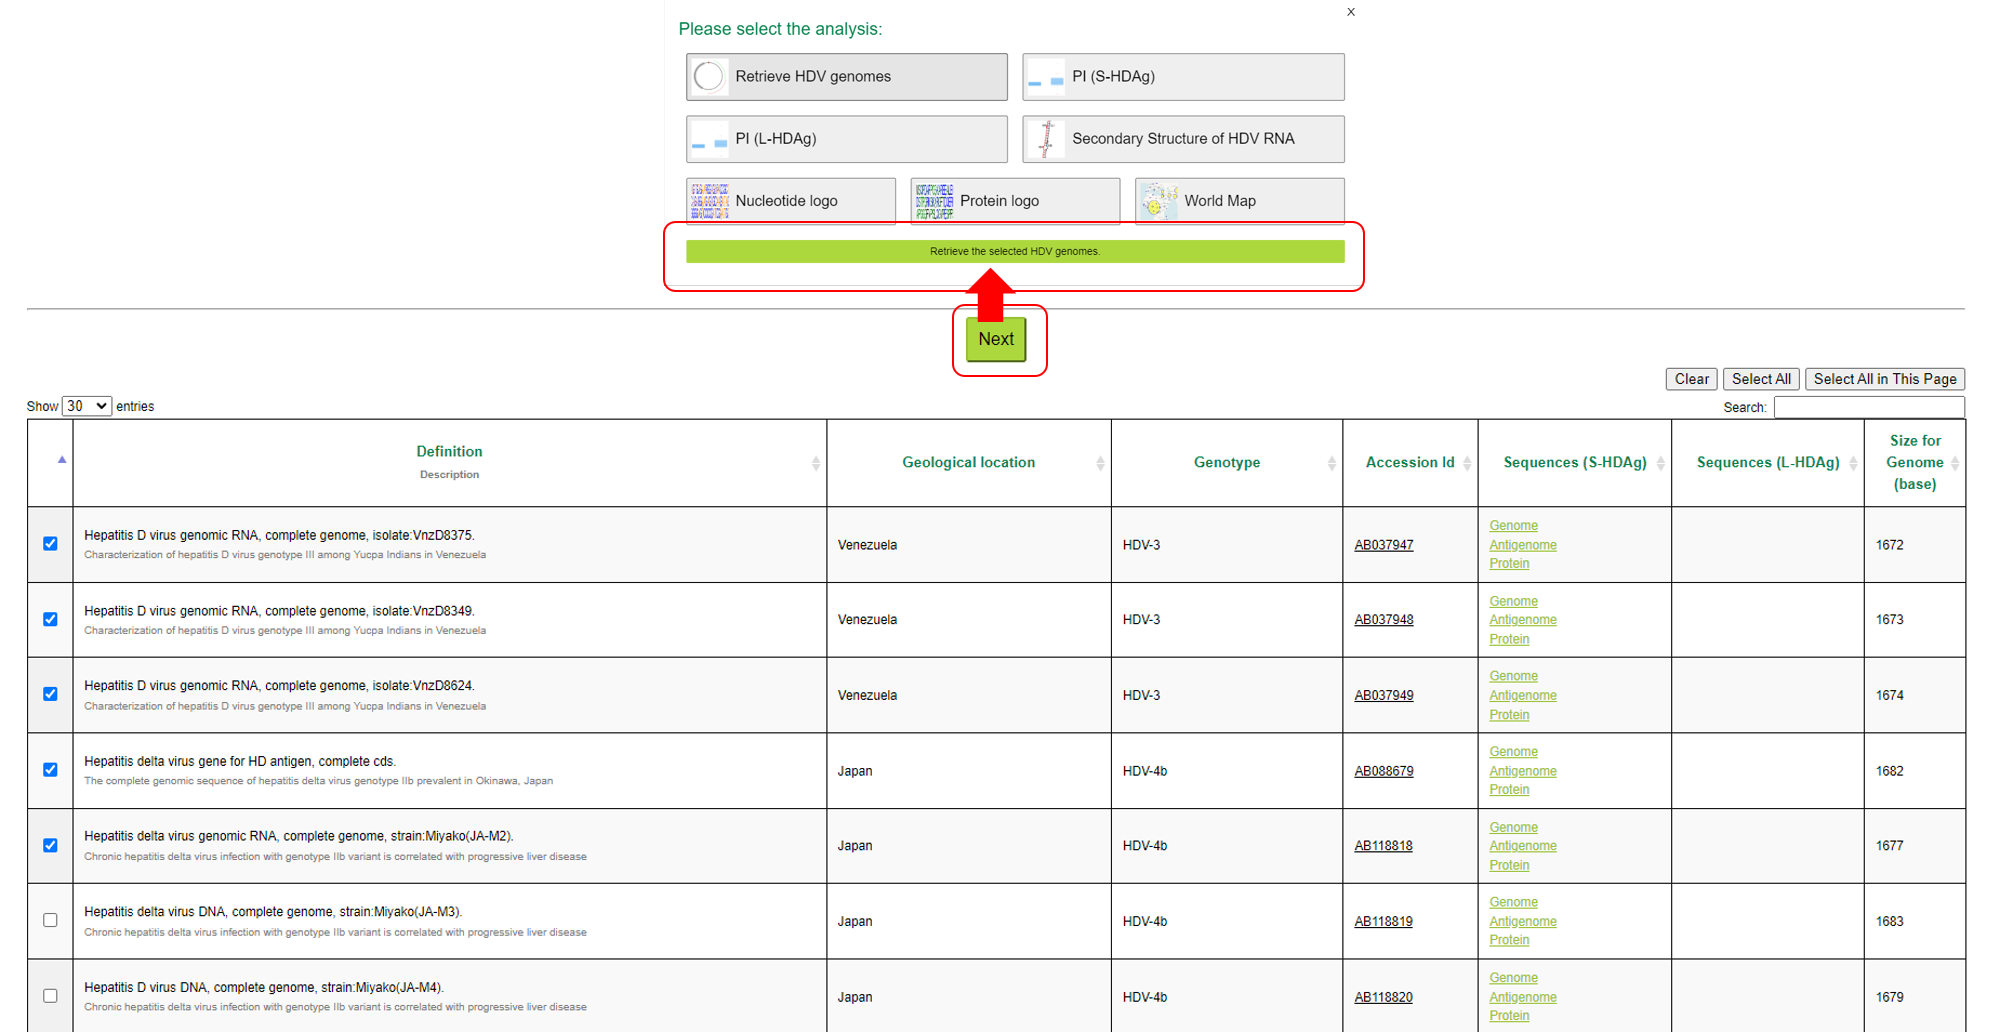
After the user selects the sequence, press Next to perform analysis. The analysis methods include Retrieve HDV genomes, PI (S-HDAg), PI (Large delta antigen, L),
Secondary Structure of HDV RNA, Nucleotide logo, Protein logo and World Map, a total of 7 types.
When the mouse cursor hovers over a button, the name of the analysis method corresponding to the current cursor position will be displayed below (the red box in the analysis menu).
1-1-1:Retrieve HDV genomes
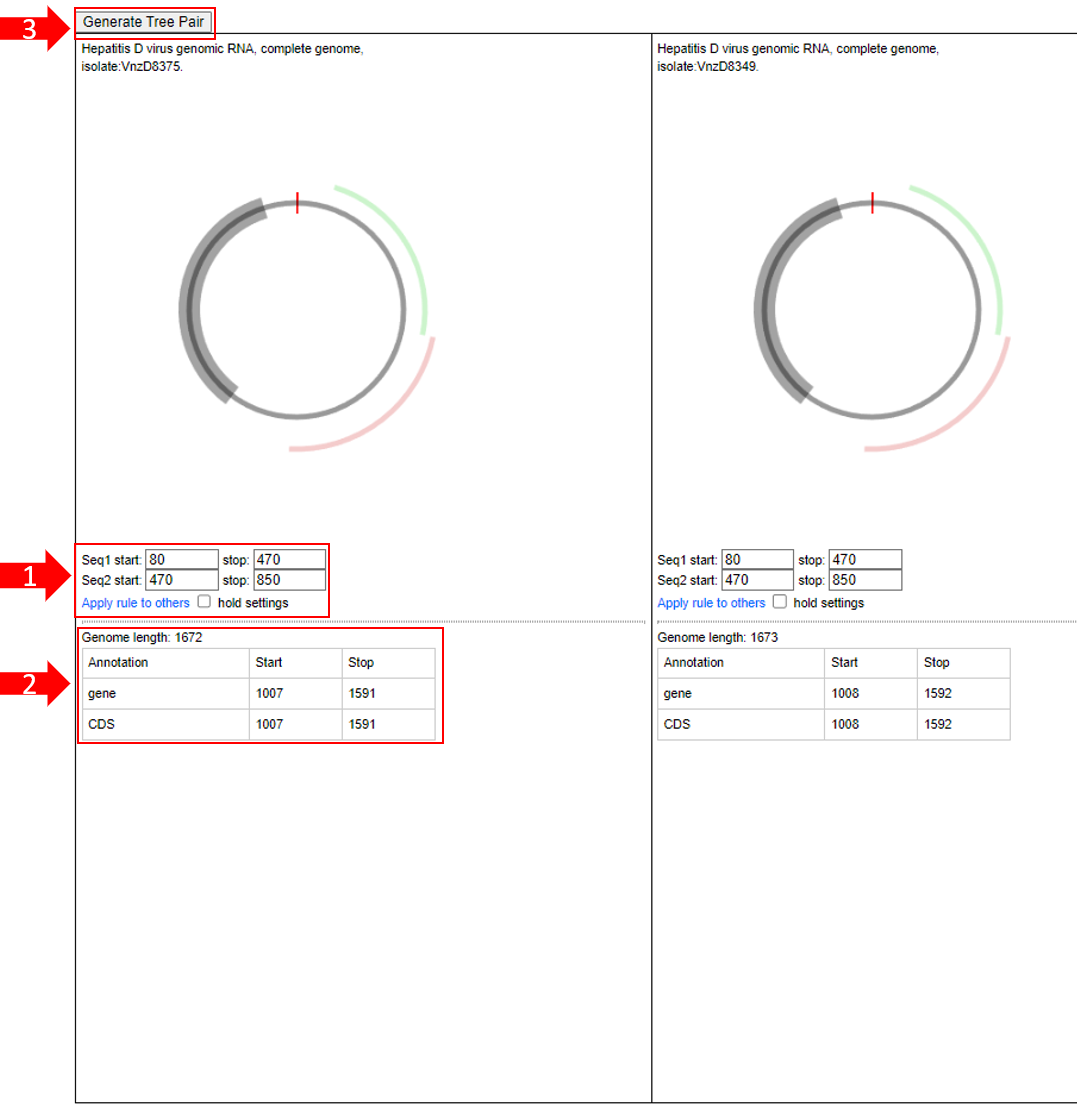
Retrieve HDV genomes compares HDV genome sequences selected by the user. Each entry contains the start and end positions of the sequence, as well as annotations of the gene and
protein coding region (CDS). Users can apply specific rules to filter and compare different sequence. In addition, settings can be saved for later viewing and analysis.
1.Partially displays the start and end positions of the sequence. Users can select "Apply rule to others" to apply the same filtering rules to other sequences, and use "hold
settings" to save the settings.
2.Partially shows the total length of the genome, as well as annotations of genes and protein coding regions (CDS), indicating the start and end positions of genes and CDS.
3.Partially allows users to select sequences for "tree generation" to observe evolutionary relationships between species.
1-1-2:Generate Tree Pair
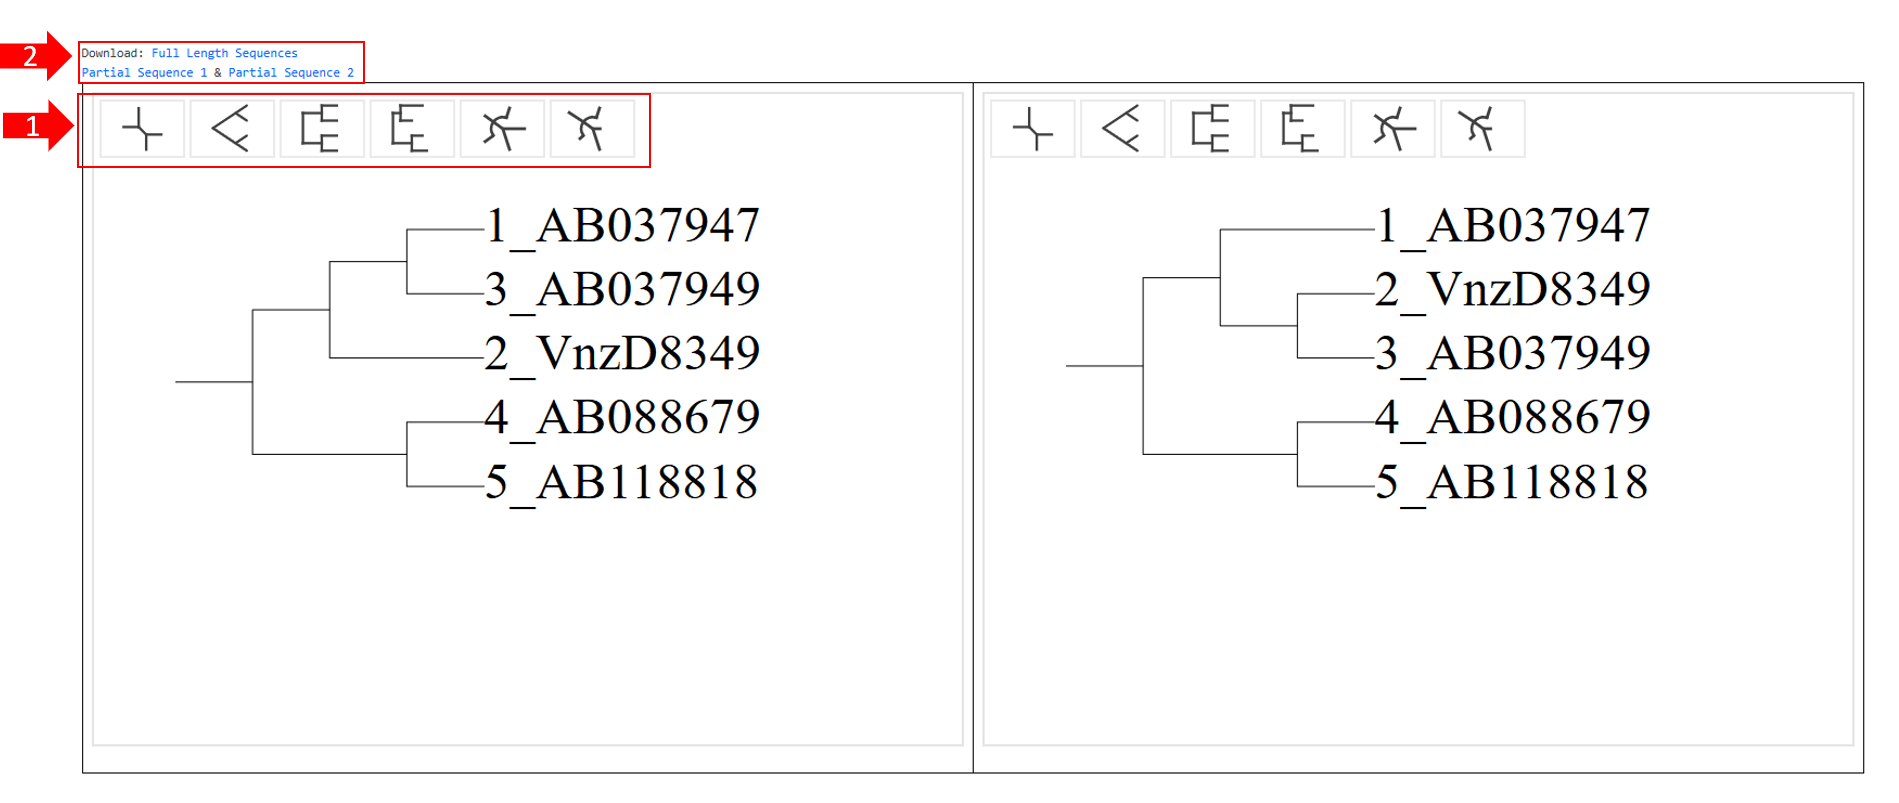
Generate Tree Pairinfers the genetic relationship between species by comparing DNA, RNA or protein sequences between species.
1. Partially provides 6 options for displaying the tree diagram.
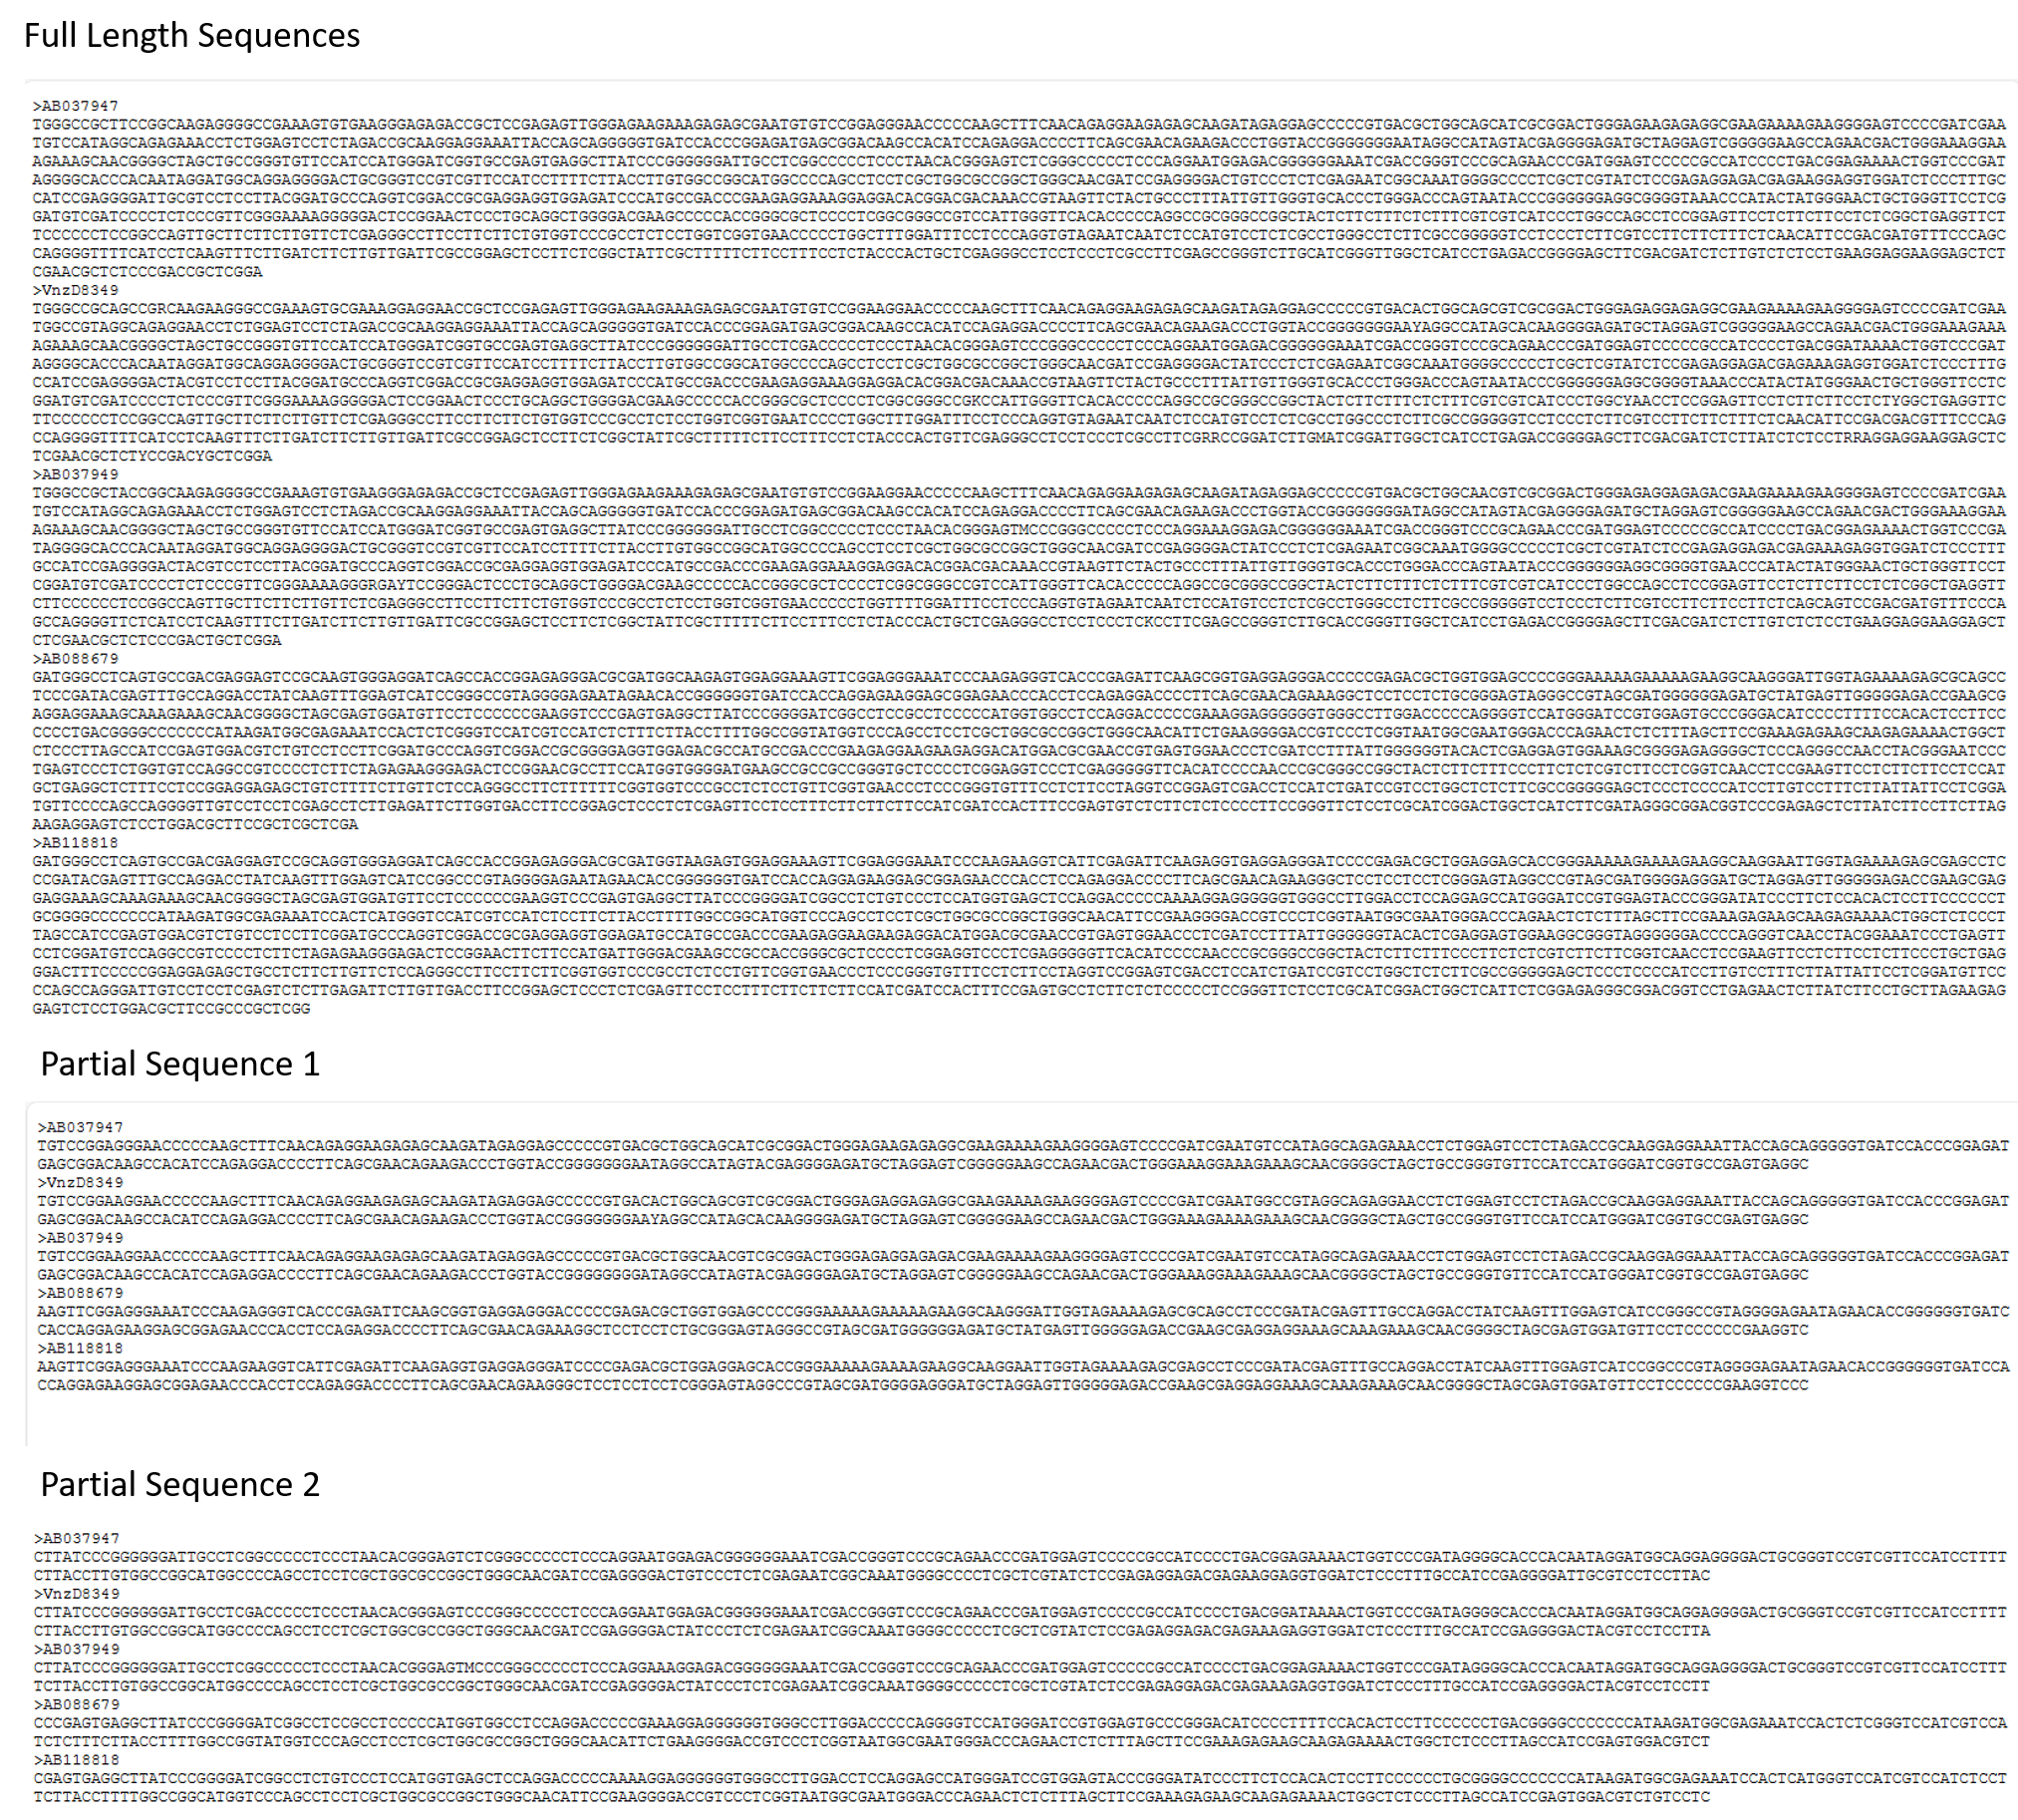
2. Partially allows downloading all sequences in full length (Full Length Sequences), or as left partial sequences (Partial Sequence 1) and right partial sequences (Partial Sequence 2).
1-2:PI (S-HDAg)
The X-axis represents the Genotype, and the Y-axis represents the PI value. It calculates and statistically analyzes the isoelectric point (pI) sequence information of the Small Antigen
HDAg, generating a box plot based on different Genotypes and their pI values.
The red box section explains the number of each Genotype and, within the distribution of PI values, shows the lowest data point (Lowest), the median of all data points (Median), the highest
data point (Highest), the first quartile (Q1), and the third quartile (Q3).
.png)
1-3:PI (L-HDAg,L)
The X-axis represents the Genotype, and the Y-axis represents the PI value. It calculates and statistically analyzes the isoelectric point (pI) sequence information of the Large Antigen HDAg,
generating a box plot based on different Genotypes and their pI values.
The red box section explains the number of each Genotype and, within the distribution of PI values, shows the lowest data point (Lowest), the median of all data points (Median), the highest
data point (Highest), the first quartile (Q1), and the third quartile (Q3).
.png)
1-4:Secondary Structure of HDV genome
Select "Secondary Structure of HDV genome" from "Next" and you will see a page like the one shown below.
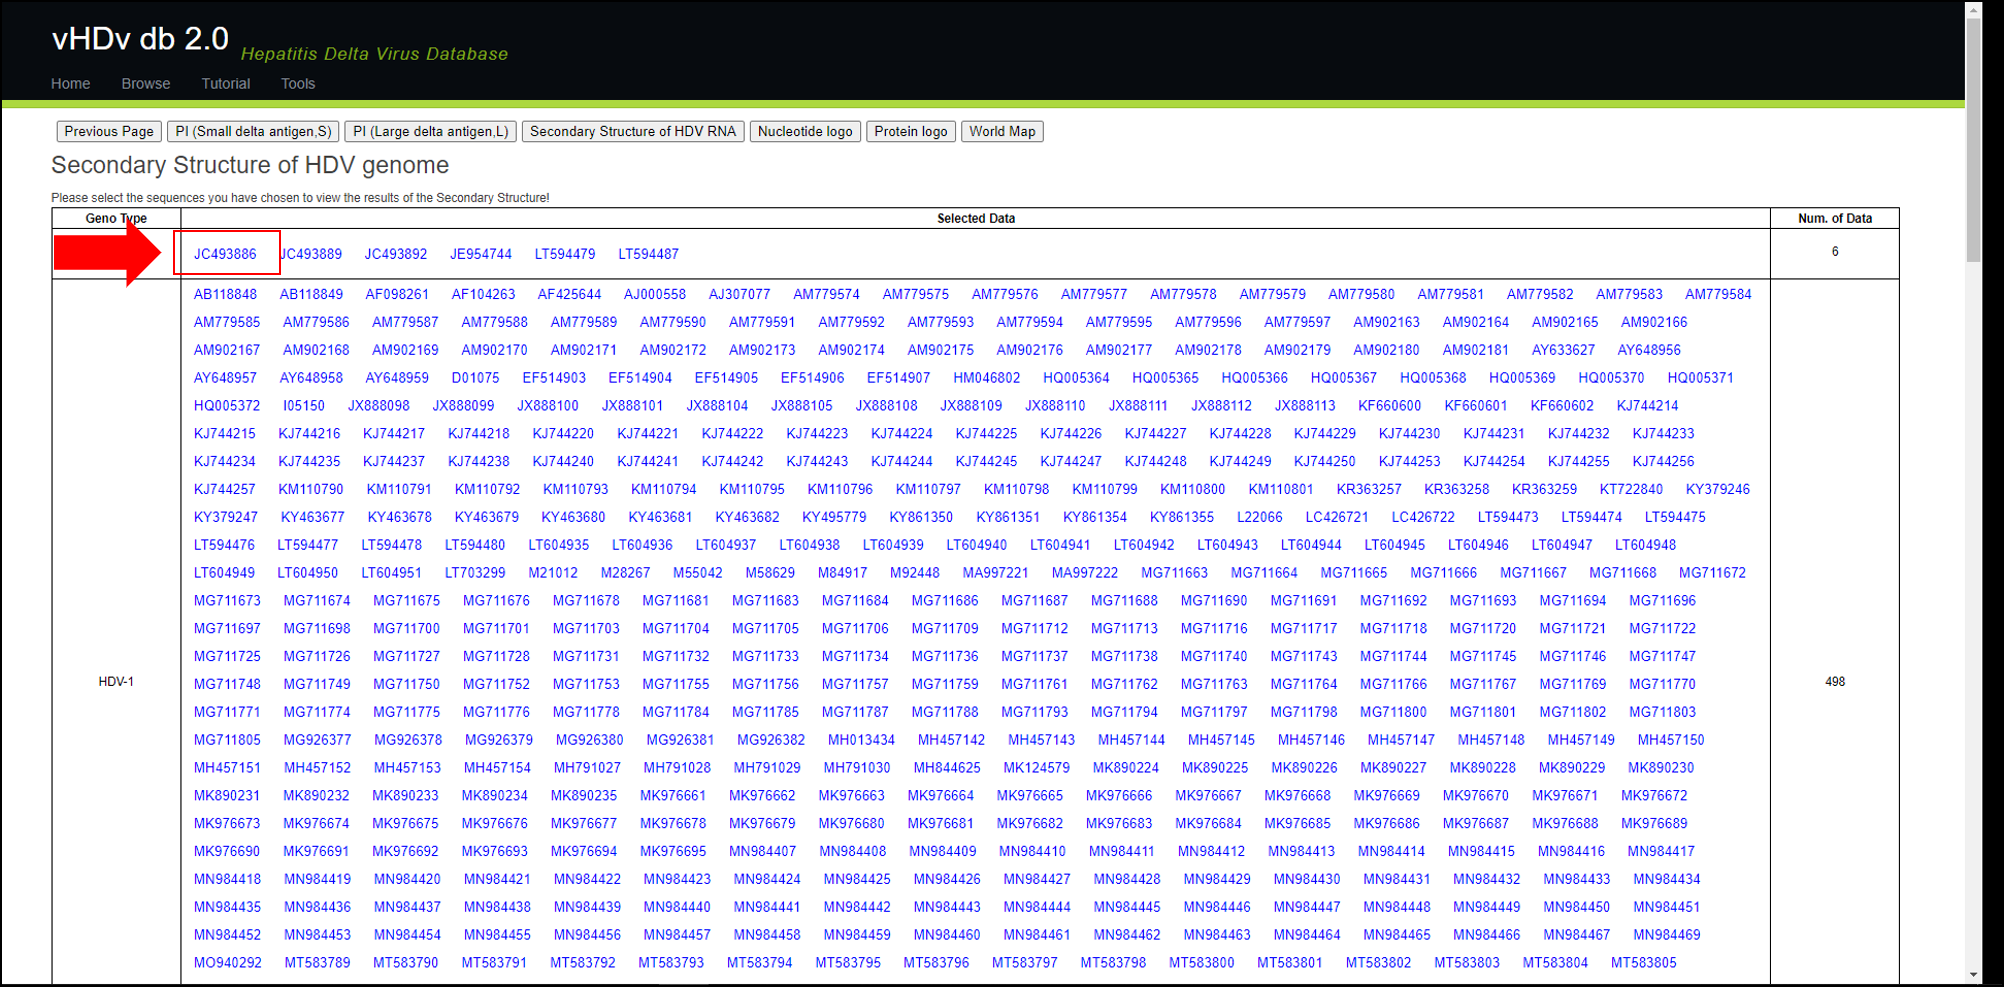
After selecting any sequence you wish to view, the Genome and Antigenome of the target sequence, as well as its image output, will appear below the table (as shown in the image).
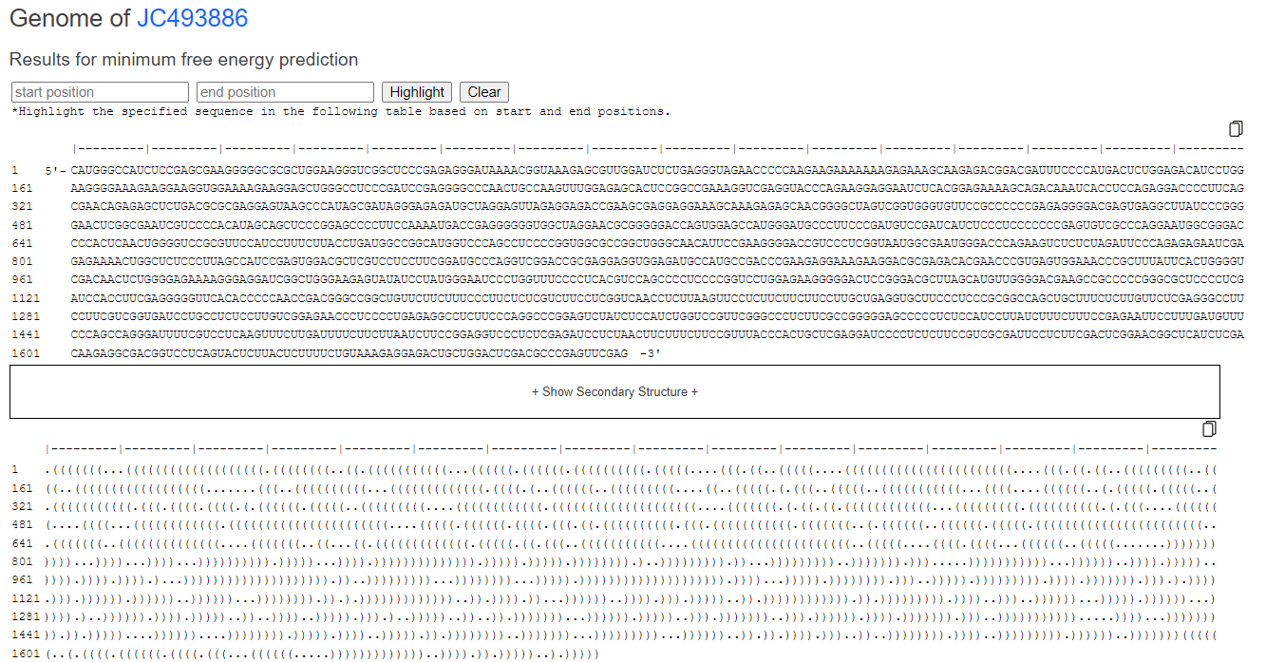
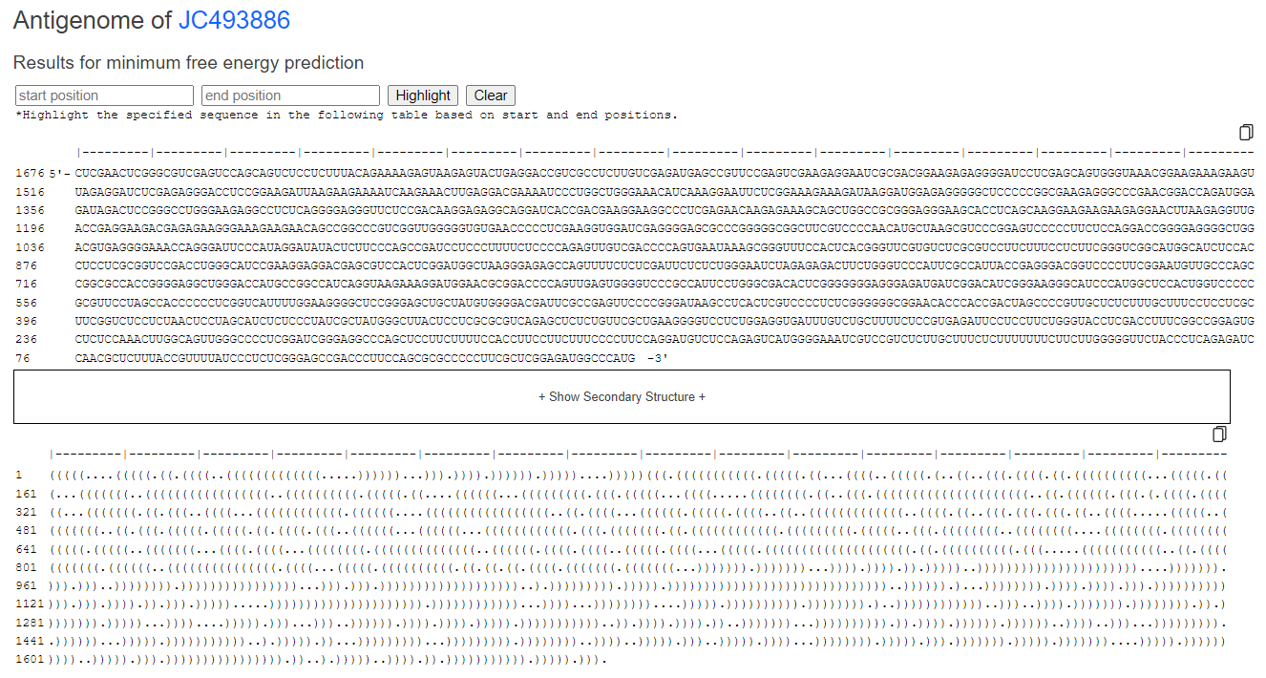
You can highlight by entering the position of interest.

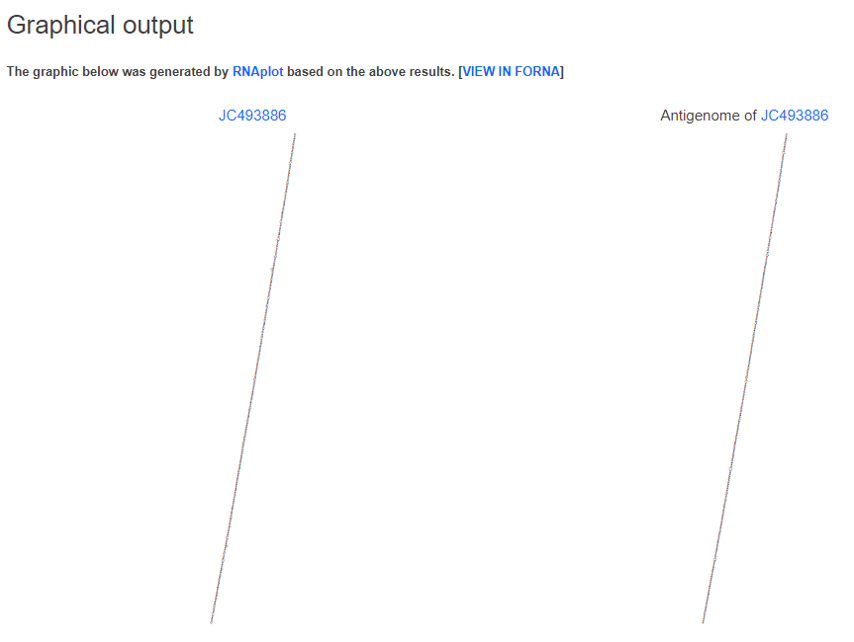
You can click on "image output" to view an enlarged version of the analysis results, and you can also scroll to examine the details.

1-5:Nucleotide logo
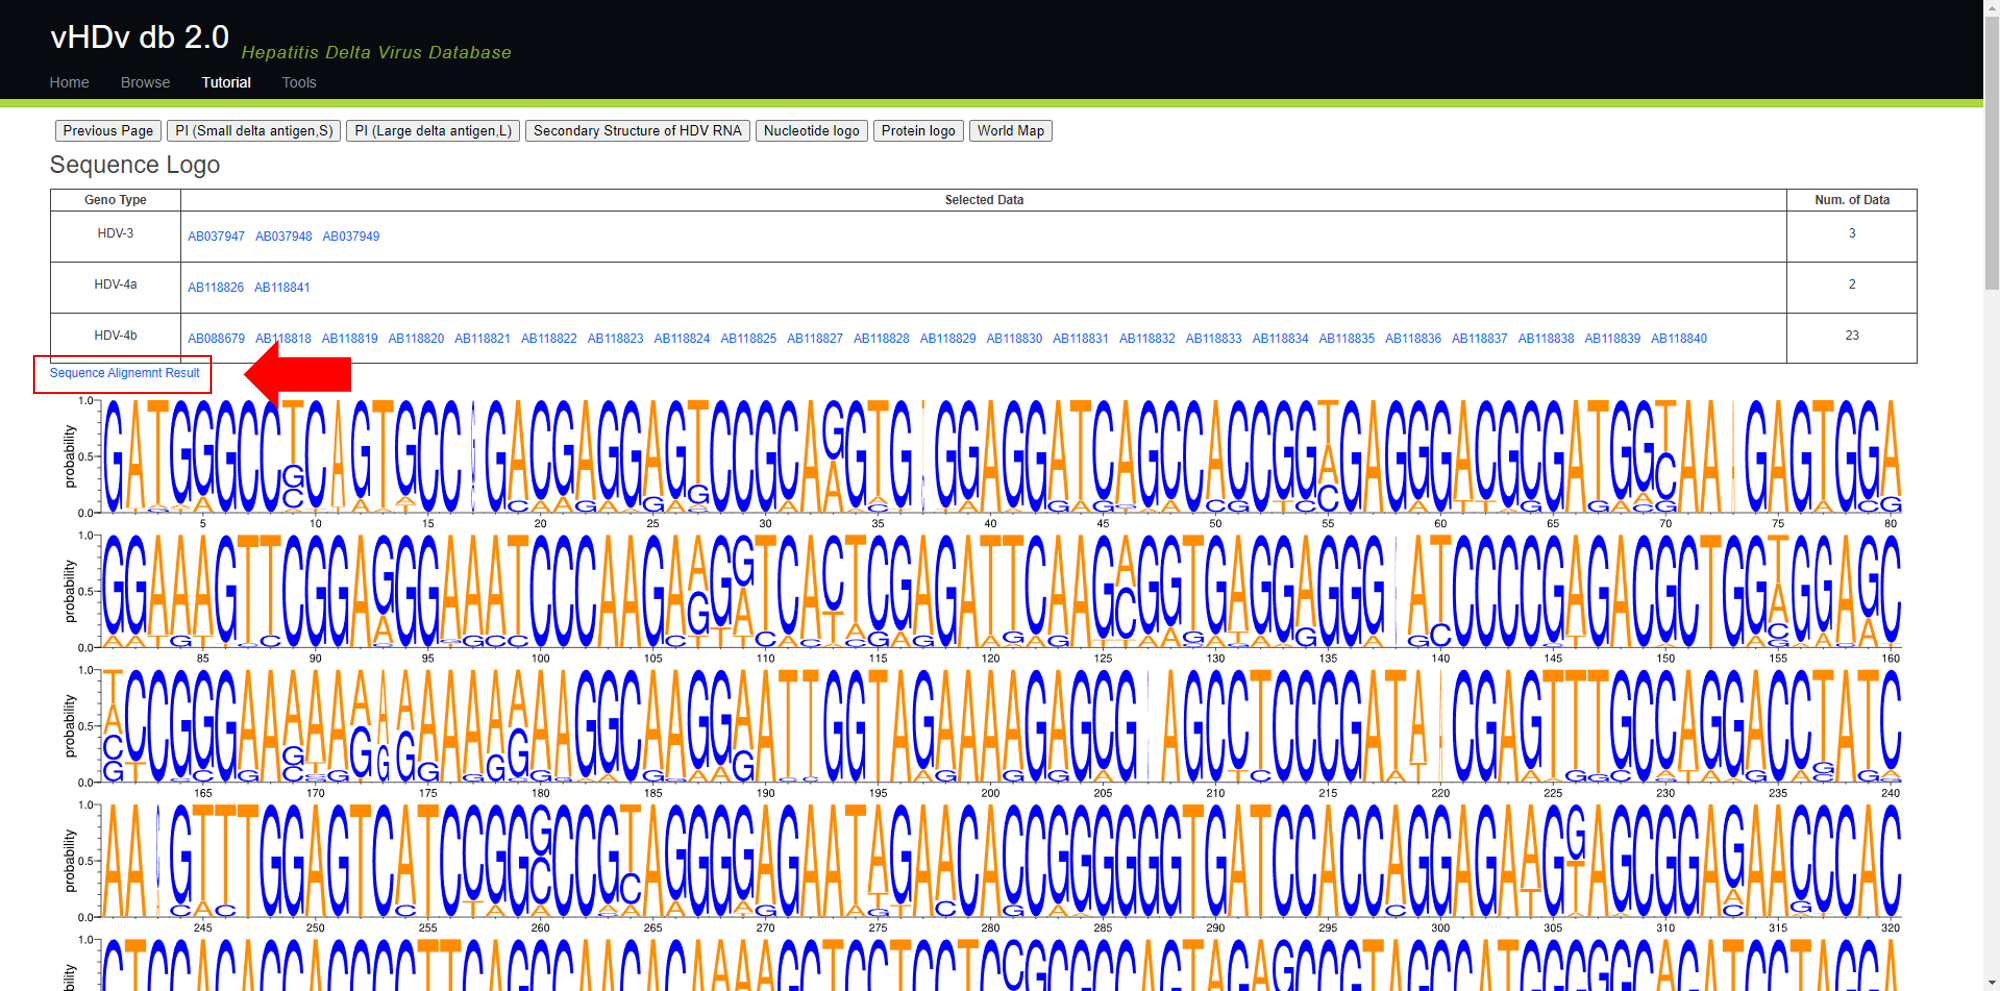
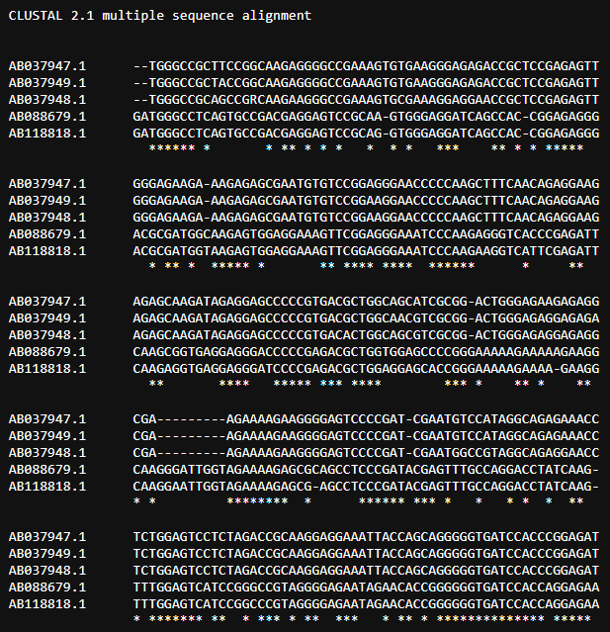
Select "Nucleotide logo" from "Next" and you will see a page like the one shown below. The content below the table will display the selected Sequence Logo image. You can click on "Sequence Alignment Result" to check the alignment results (as shown in the image).
(If you click on a sequence in the table, you will be redirected to the corresponding NCBI page for that sequence.)
1-6:Protein logo
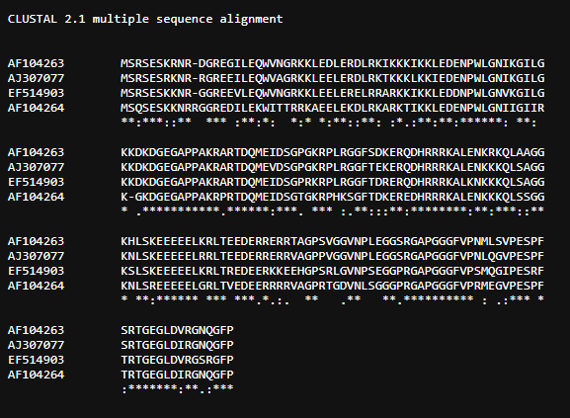
Select "Protein logo" from "Next" and you will see a page like the one shown below. The content below the table will display the selected Sequence Logo image. You can click on "Sequence Alignment Result" to check the alignment results (as shown in the image).
(If you click on a sequence in the table, you will be redirected to the corresponding NCBI page for that sequence.)

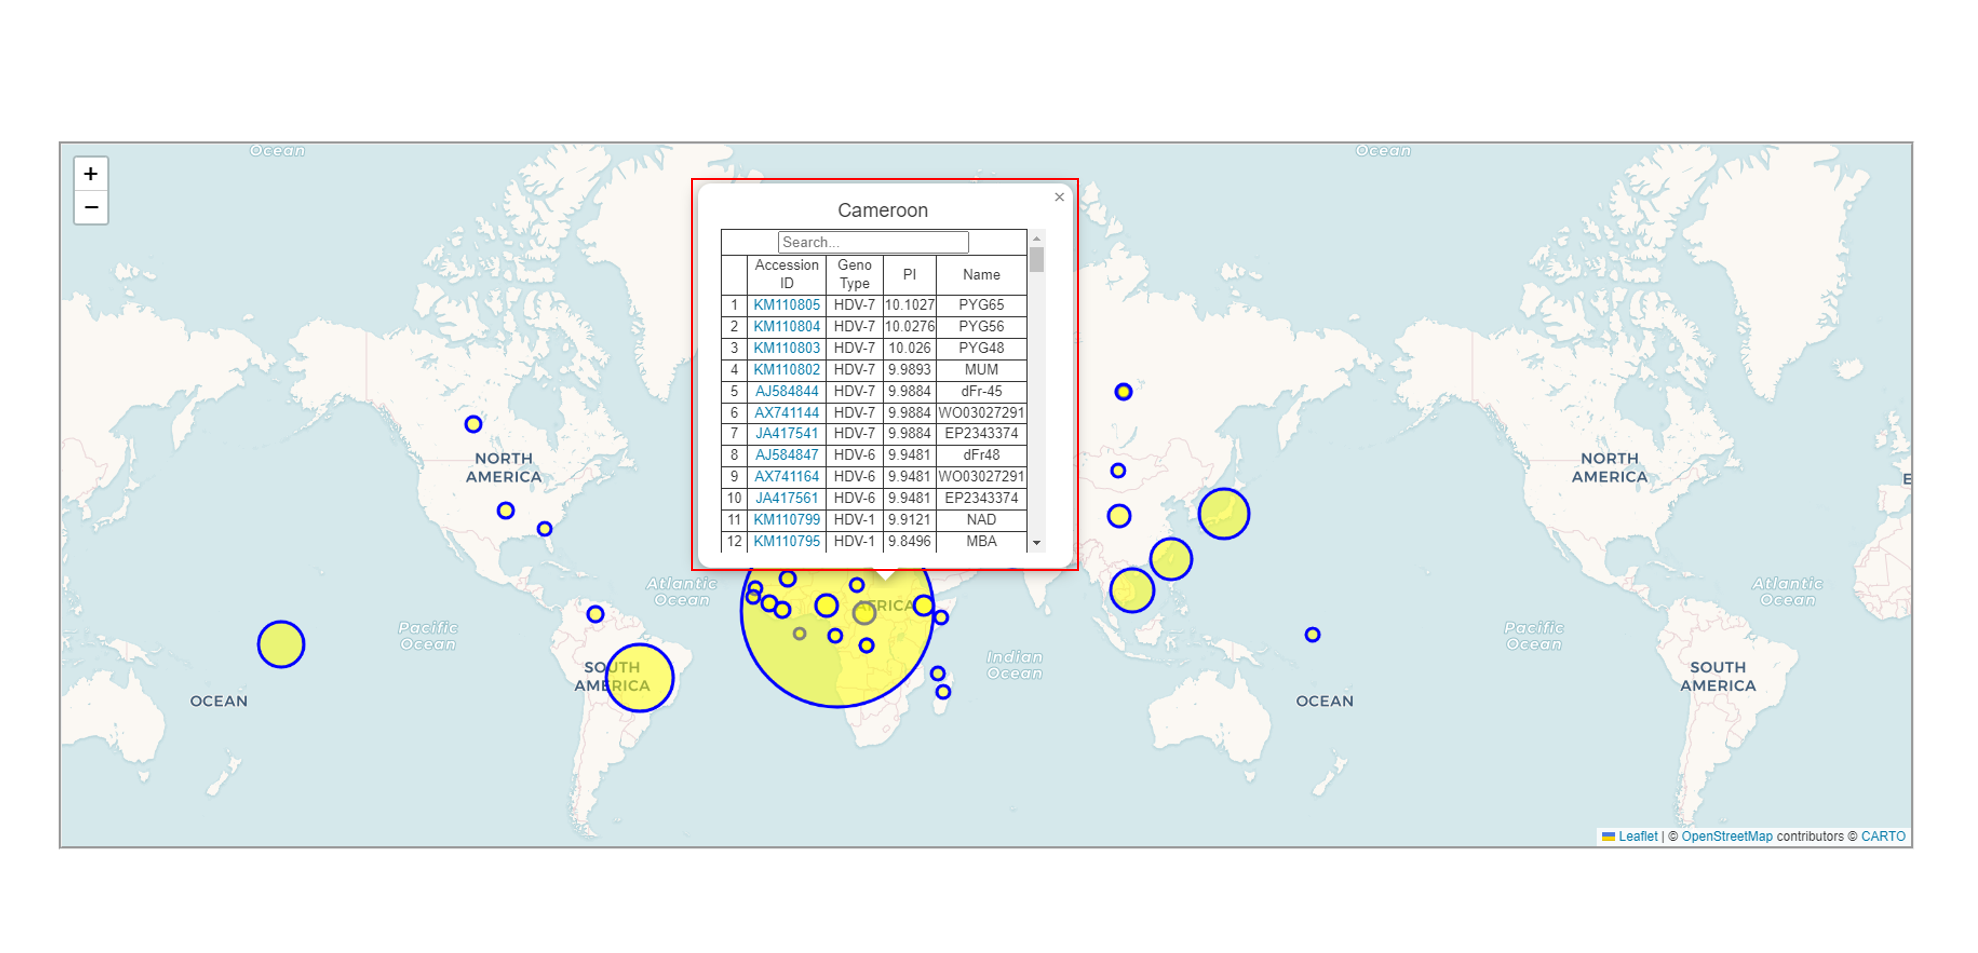
1-7:World Map
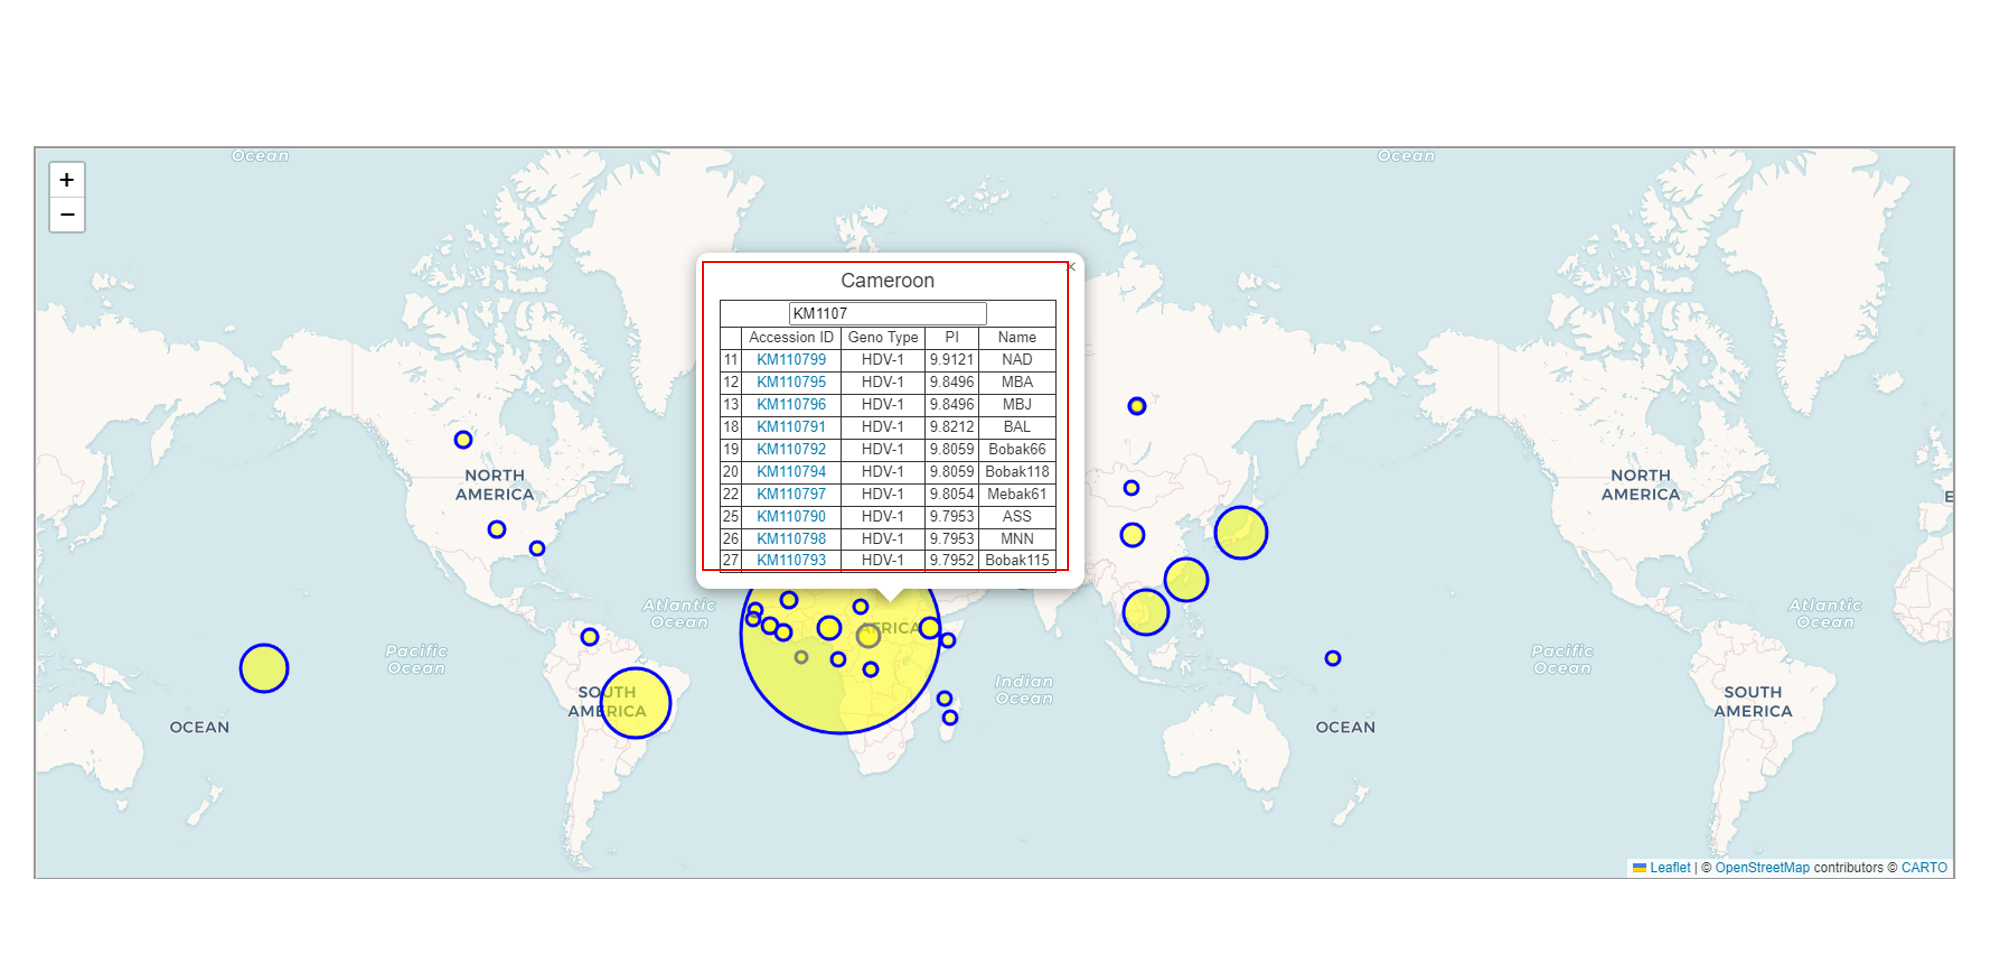
Below the table, there is a world map that displays the origin of the sequences you selected. The larger the circle, the greater the amount of data from that region.
You can select one of the circles to perform a query. You can enter the content of any field, such as Accession ID, Gene Type, PI, or Name, to conduct the search. The more detailed the input, the more precise the results will be.
Part2:Tools
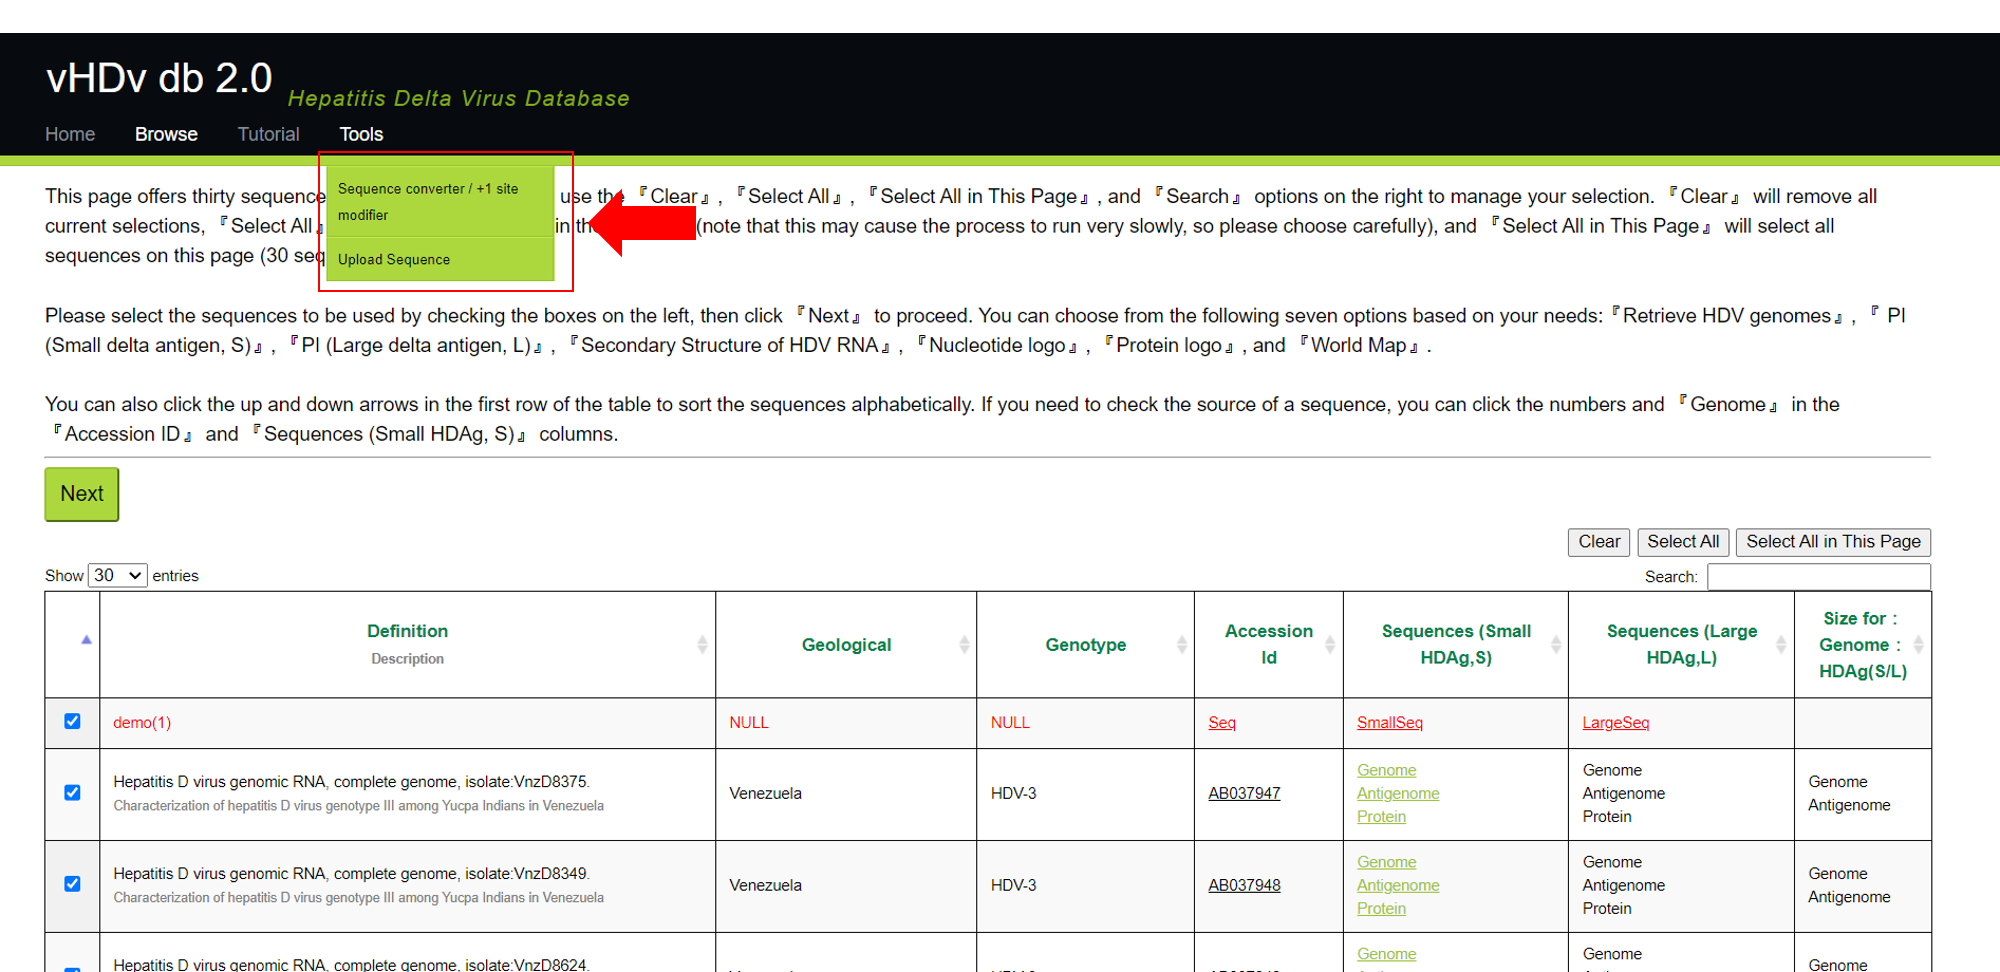
As shown in the image below, when you hover your mouse over『tools』, a menu will appear for you to choose from. Inside, there are『Sequence converter / +1 site modifier』and『Upload Sequence』options for you to select. The following sections will introduce these two features in sequence.
2-1:Sequence converter / +1 site modifier
After clicking on 『Sequence converter / +1 site modifier』, you will see a screen as shown below. By clicking on 『upload』, you can select a gbk file from your device and have it automatically adjusted according to your needs.

After you upload the specified gbk file, you will see the following screen.
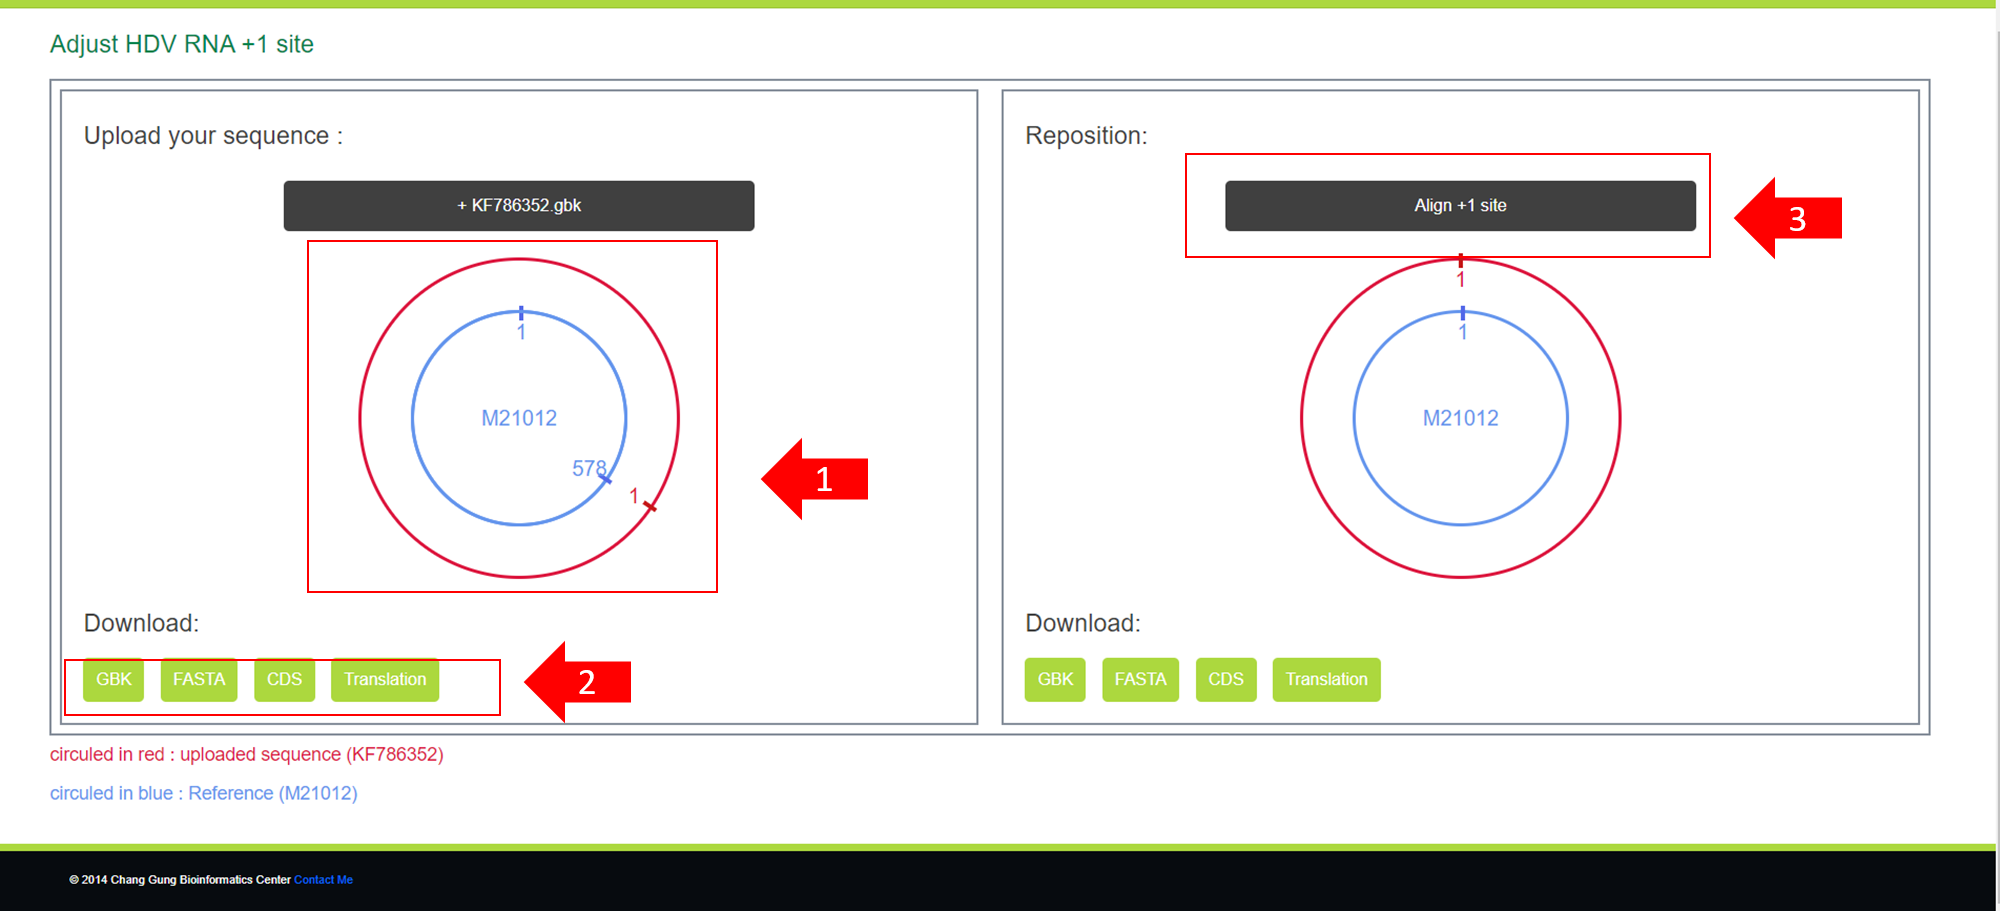
1.You can see how far the starting position of your uploaded sequence differs from our reference sequence (M21012). (In the image, it is shifted 578 positions to the right)
2.You can download the uploaded GBK file as a GBK file, a FASTA file, CDS positions, and translations.
3.You can click this button to perform automatic alignment. At the same time, you can also download the aligned sequences.
2-2:Upload Sequence
After selecting 『 Upload Sequence 』, you will see the following screen. We have included a simple example here, and you can modify the example in the same format. Users need to upload and fill in six items: Name, Geological, Genotype, Nucleotide Sequence upload, Protein Sequences (Small HDAg, S), and Protein Sequences (Large HDAg, L). If you just want to test whether the upload works, you can use our Demo file available for download below.

After the upload is complete, you will see your uploaded sequences displayed on the 『Browse』 page, as shown in the image below.
If you need to analyze this sequence, the usage is the same as for other sequences. Simply select the sequence you uploaded and click 『NEXT』 to proceed with the subsequent steps. You can refer to the description in Part 1 for detailed instructions.
**Note: The 『Retrieve HDV genomes』,『PI (S-HDAg)』,and 『World Map』 features do not currently support user-uploaded functionality!
